Create interactive graphs, stunning maps, and live dashboards in minutes. Save your viz to your Tableau Public profile, and share it anywhere on the web.
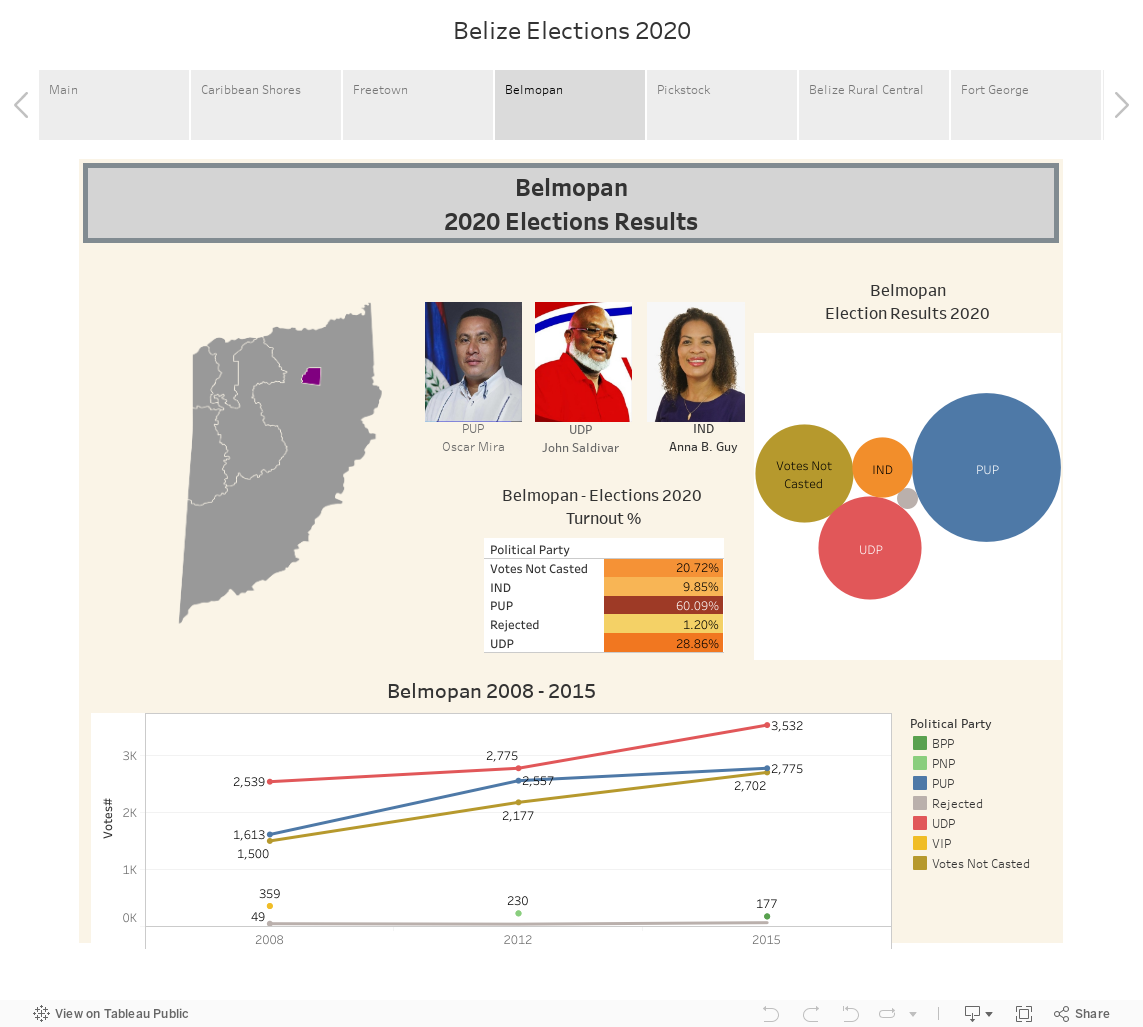
This dashboard was done for the Belize general elections in 2020 by Juan Carlos Sarabia and statistical students from the University of Belize. The idea was to give Belizeans a Live Demonstration of an interactive dashboard that showed the past results(going back to 2008) and current results for the 2020 General Elections.

The dashboard displayed the different representatives for the selected constituency.

This section showed a line graph of the past results of the different political parties that have participated since 2008 General Elections.

This section displayed the turnout percentage of the 2020 Belize General Elections